Business statistics in Australia at a glance
- There are around 2.72m business operating in Australia.
- New South Wales has the most business (916,603) of any state or territory and the highest number of businesses per person (approx 0.105 per person).
- Construction is Australia's biggest industry in terms of the number of businesses trading (462,939).
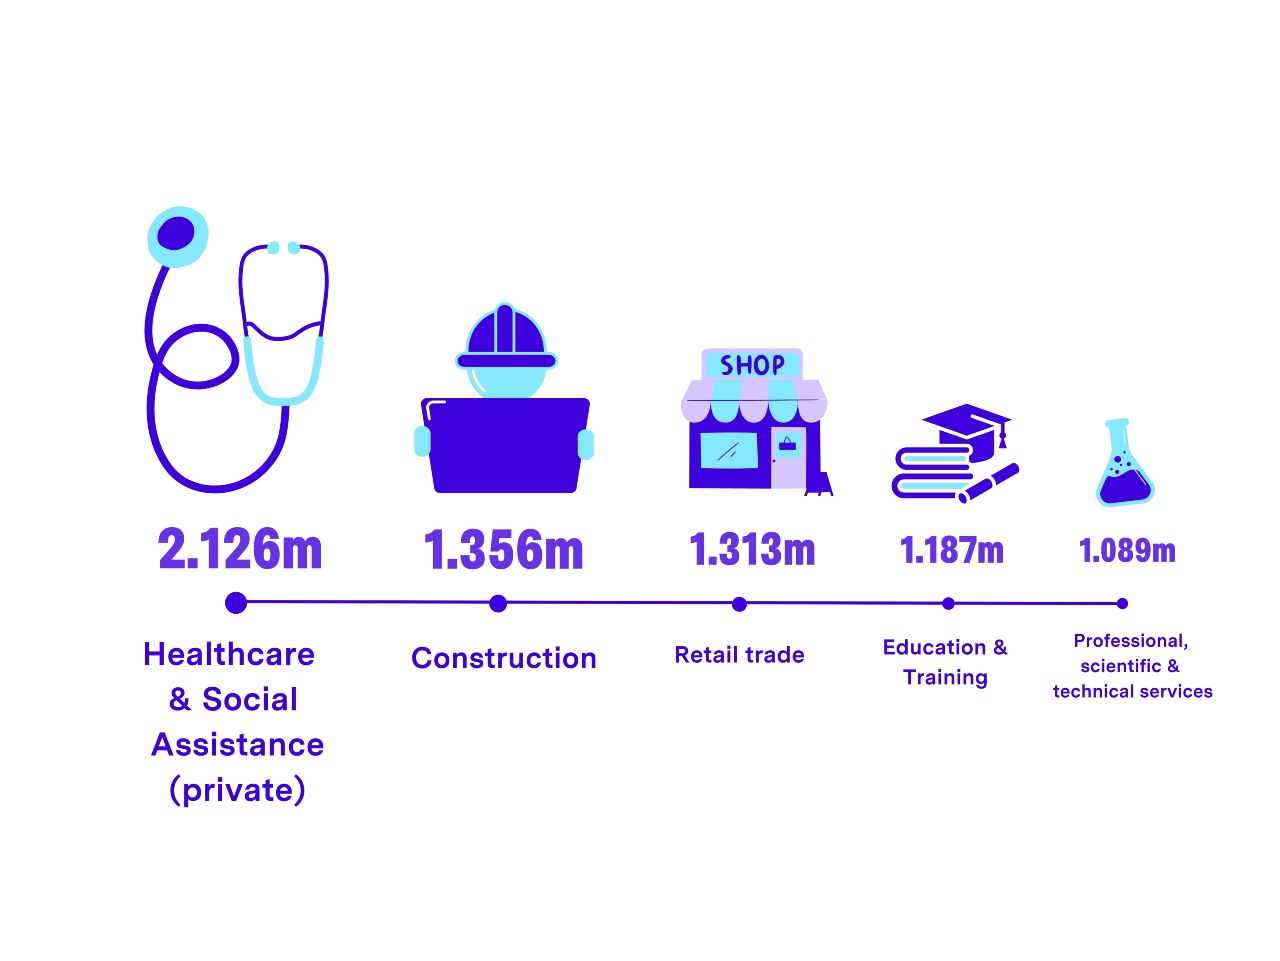
- Healthcare and social assistance is biggest for number of people employed (2.126m).
- Only 75% of Australian businesses survive past their first year of trading.
- Around 97.3% of businesses in Australia are small businesses (0-19 employees).
- Businesses involved in non-metallic mineral mining and quarrying have the highest average profit margin (49.4%).
- Business involved in private hospitals recorded the lowest average profit margin (-0.1%).
Want to see more Money.com.au research and insights? Add us as a preferred source in Google Search.
Number of businesses in Australia
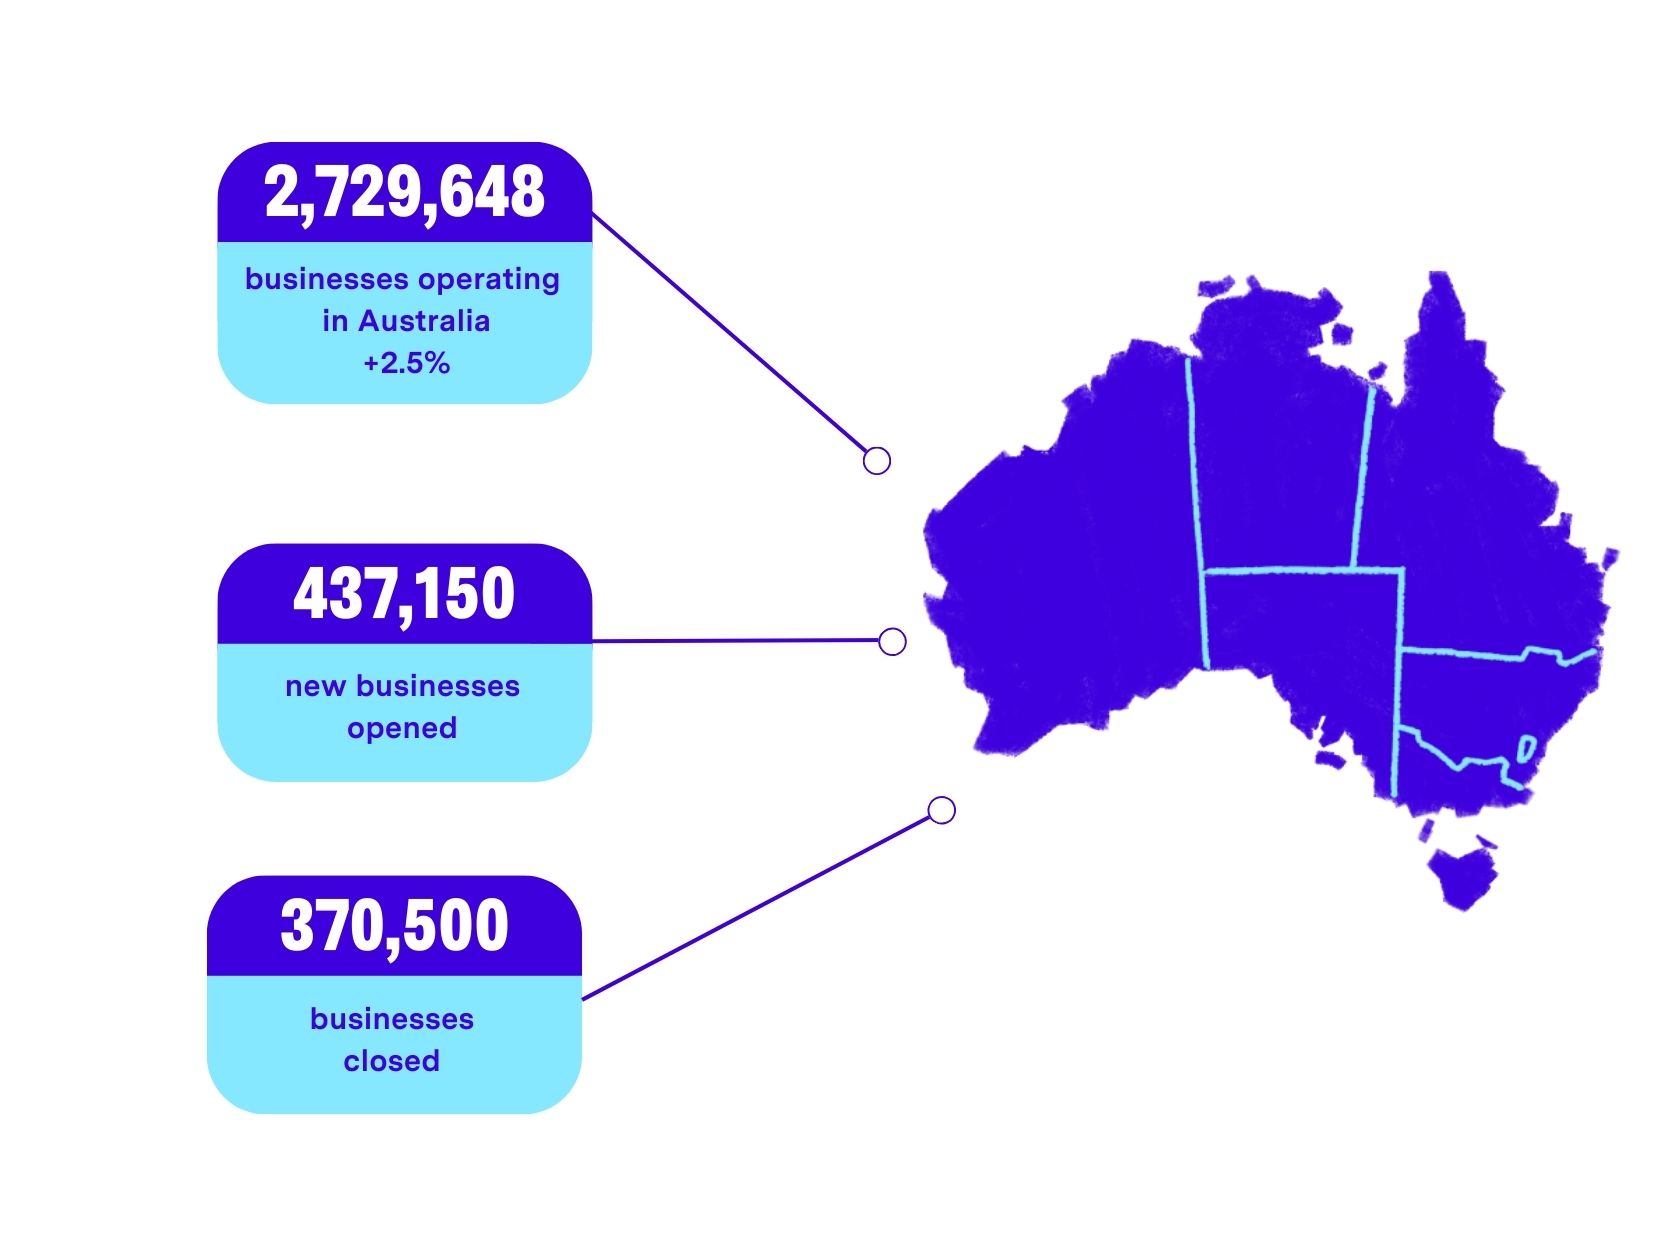
Overall, there were 2,729,648 actively trading businesses in Australia as of 30 June 2025, according to the Australian Bureau of Statistics. To put that into perspective, there's just shy of one Australian business for every 10 people in the country.
Based on Australian Bureau of Statistics figures for the 2024/25 financial year.
There was a 2.5% increase in the number of businesses operating at the end of FY 2024/25 compared to the start of the year, or 66,650 extra businesses. That rate of growth is slightly higher than it was in 2022/23 (+2.0%), but down on the 2021/22 when the growth in business numbers was twice as high (+5.6%).
Here's how the number of businesses has changed over the years...
Types of businesses operating in Australia
The company structure dominates (44%), followed by sole proprietors (30%), trusts (18%), then partnerships (8%). The remainder (only 398) are public sector businesses.
According to Dr Pratiti Chatterjee, Senior Lecturer in Economics at the University of Western Australia, new businesses opening in large numbers is encouraging to see in the short term, but doesn't necessarily translate to longer-term growth.
“After three or five years, you probably see that a lot of these businesses have exited the economy due to the fact that they're not sufficiently productive or adding as much value as was expected,” she said.
“In terms of a very broad picture, smaller businesses are really having a tougher time.
“The hospitality sector in particular is seeing dwindling profit margins, coupled with the fact that households have tight budget constraints right now, which means room for discretionary spending is lower.”
The challenges facing many Australian businesses are reflected in the increasing number of companies entering external administration, rising by 20% between FY 2023/24 and FY 2024/25.
Industry-by-industry business statistics
Of course, some sectors of the economy can weather turbulence better than others. Let's look at the current industry-by-industry business number breakdown.
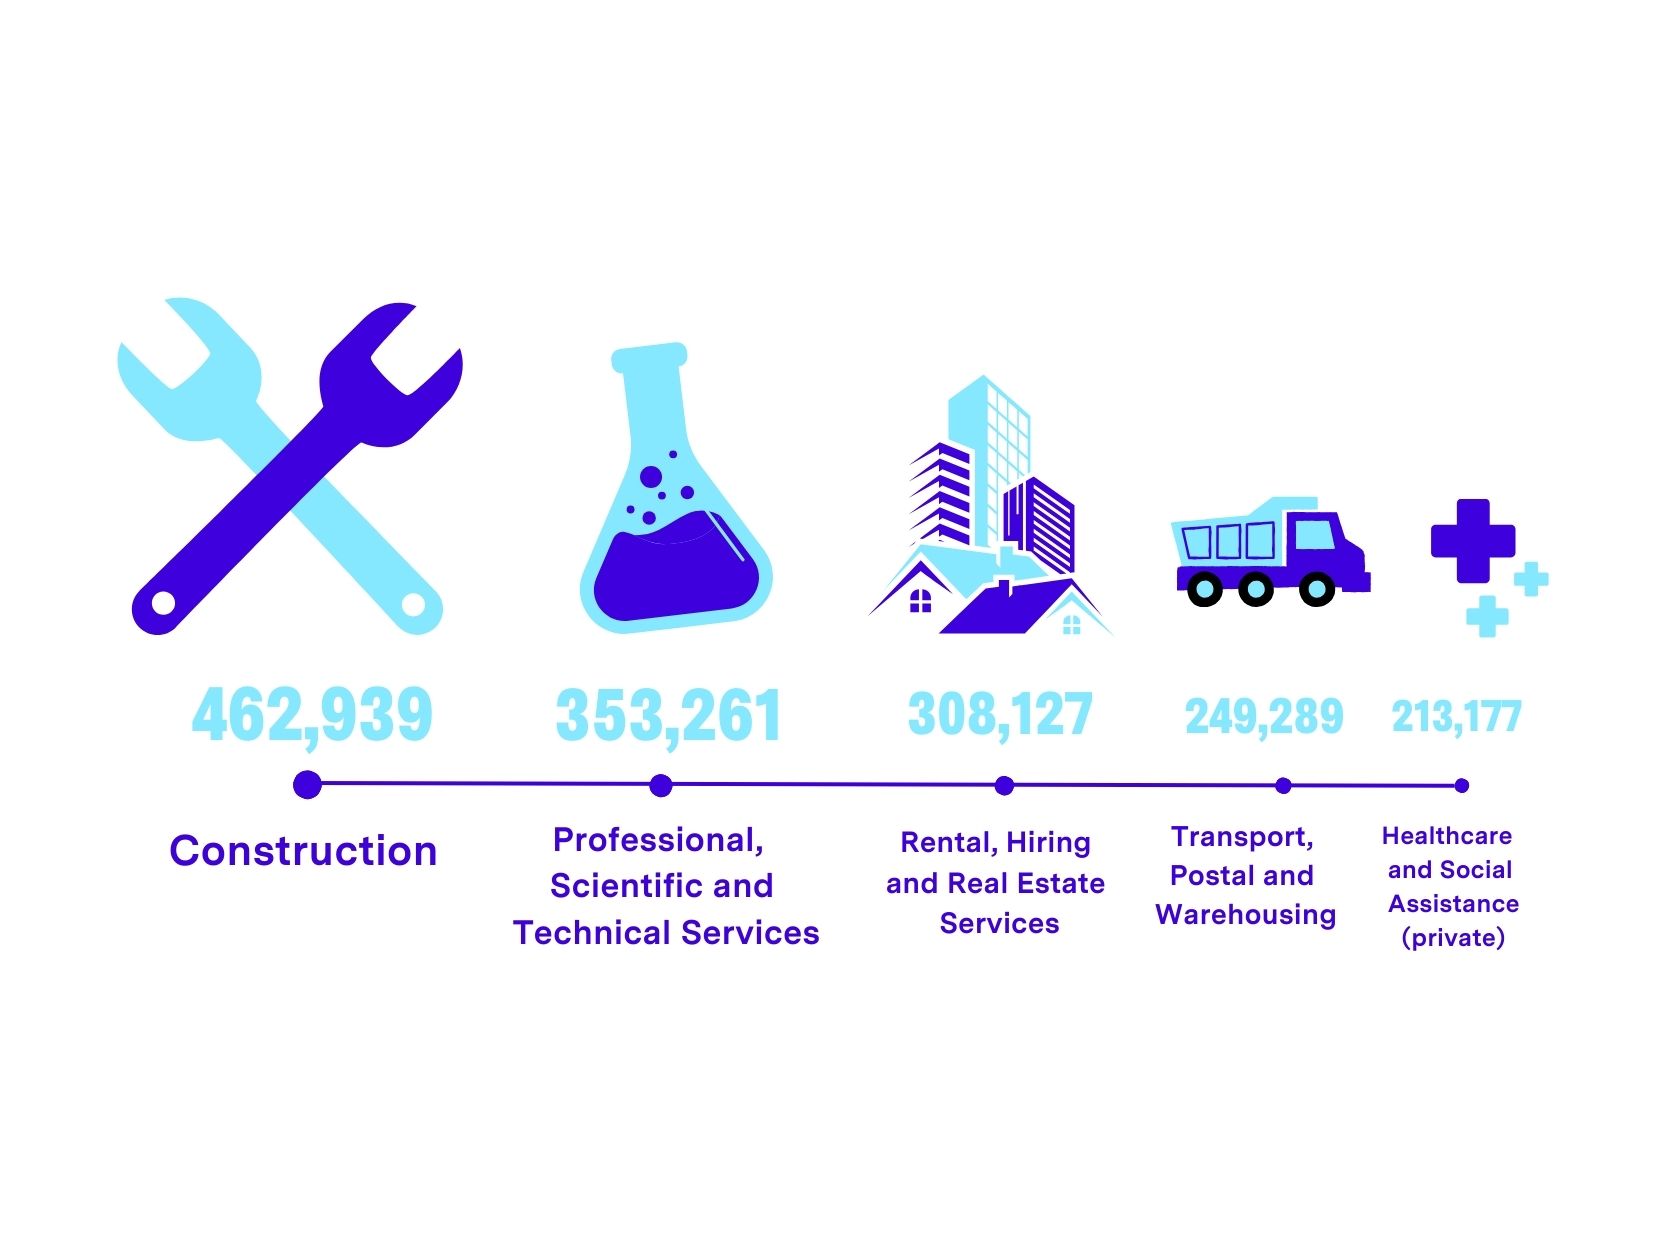
Construction remains Australia's largest industry by number of businesses operating. It grew by 2.2% (+10,002 businesses) in 2024-25.
Transport, Postal and Warehousing (+5.1%), Health Care and Social Assistance (+6.6%), and Financial and Insurance Services (+3.7%) were the sectors with the biggest growth last year in terms of the number of businesses operating.
Agriculture, Forestry and Fishing (-0.8%) and Retail Trade (-0.4%) were the only industries to record a decline in total number of businesses operating in 2024/25.
Largest industries by number of employees
The traditional industries dominate here too, with healthcare, social assistance, and retail combined making up almost 24% of Australia's workforce.
Survival rate of new businesses
The survival rate of new businesses varies significantly between industries. On one end of the scale, just under 61.1% of agriculture, forestry and fishing businesses survived beyond three years of operating (among businesses started in the 2020/21 financial year).
At the other end, only 35.1% of transport, postal and warehousing businesses survived over the same time frame. The overall survival rate across all industries was just under half, sitting at 40.8%.
Looking ahead, Dr Chatterjee said two of Australia's largest sectors – mining and third-level – education could be vulnerable over the coming year.
In the case of mining, China’s slowing economic growth is likely to continue impacting iron ore exports. For universities, foreign student caps will present a challenge.
According to Yanir Yakutiel, CEO of business lender, Lumi, construction is another area of concern.
"Continued RBA rate increases have put further pressure on house prices and development, with lead contractors on fixed contracts particularly exposed," he said.
State-by-state business statistics (number of businesses operating)
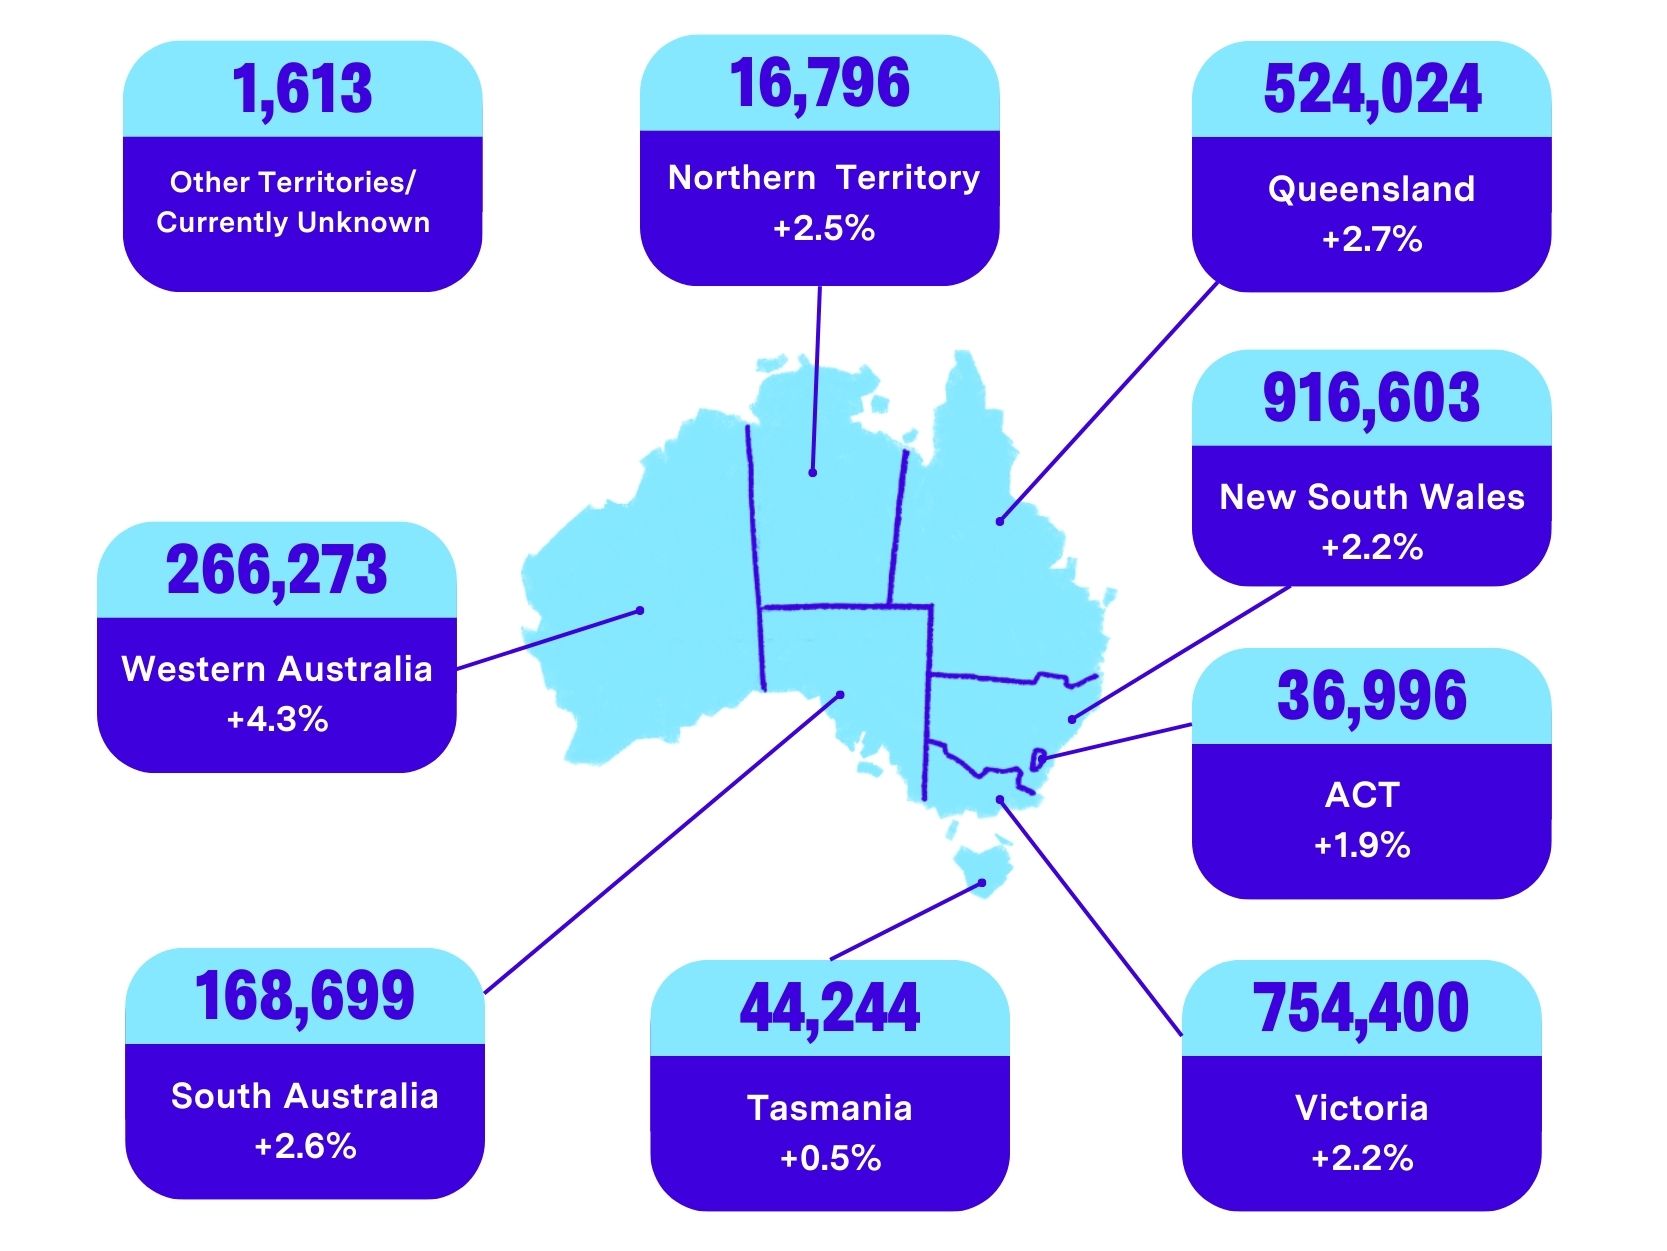
Queensland and South Australia enjoyed the joint largest percentage growth in businesses operating in 2024/25.
However, New South Wales added the most new businesses in total (+20,040) and remains the state with the highest total number of businesses (916,603).
Queensland continues to be the preferred destination for businesses moving interstate, adding 1,250 new from other states last financial year.
Looking at the number of businesses per head of population, New South Wales has the highest at 0.106 businesses per person. Tasmania has the lowest at 0.076.
State-by-state churn of businesses
State/territory | New South Wales |
|---|---|
Businesses opened | 147,571 (-1.2%) |
Businesses closed | 126,475 (+3.0%) |
Net migration in/out of state | -1056 |
State/territory | Victoria |
Businesses opened | 123,428 (-.93%) |
Businesses closed | 106,858 (+1.2%) |
Net migration in/out of state | -84 |
State/territory | Queensland |
Businesses opened | 82,254(+1.7%) |
Businesses closed | 69,925 (+1.6%) |
Net migration in/out of state | 1,250 |
State/territory | South Australia |
Businesses opened | 25,135 (+0.8%) |
Businesses closed | 20,809 (+3.6%) |
Net migration in/out of state | -81 |
State/territory | Western Australia |
Businesses opened | 43,723 (+1.6%) |
Businesses closed | 33,190 (+1.6%) |
Net migration in/out of state | 344 |
State/territory | Tasmania |
Businesses opened | 5,593 (-7.6%) |
Businesses closed | 5,321 (+1.4%) |
Net migration in/out of state | -54 |
State/territory | Northern Territory |
Businesses opened | 2,786 (+1.5%) |
Businesses closed | 2,238 (-4.7%) |
Net migration in/out of state | -132 |
State/territory | Australian Capital Territory |
Businesses opened | 6,335 (-2.5%) |
Businesses closed | 5,469 (+6.4%) |
Net migration in/out of state | -187 |
State/territory | Other territories/unknown |
Businesses opened | 325 (+52%) |
Businesses closed | 215 (-3.1%) |
Net migration in/out of state | 0 |
| State/territory | Businesses opened | Businesses closed | Net migration in/out of state |
|---|---|---|---|
New South Wales | 147,571 (-1.2%) | 126,475 (+3.0%) | -1056 |
Victoria | 123,428 (-.93%) | 106,858 (+1.2%) | -84 |
Queensland | 82,254(+1.7%) | 69,925 (+1.6%) | 1,250 |
South Australia | 25,135 (+0.8%) | 20,809 (+3.6%) | -81 |
Western Australia | 43,723 (+1.6%) | 33,190 (+1.6%) | 344 |
Tasmania | 5,593 (-7.6%) | 5,321 (+1.4%) | -54 |
Northern Territory | 2,786 (+1.5%) | 2,238 (-4.7%) | -132 |
Australian Capital Territory | 6,335 (-2.5%) | 5,469 (+6.4%) | -187 |
Other territories/unknown | 325 (+52%) | 215 (-3.1%) | 0 |
How many small businesses are there in Australia?
The business sector in Australia is dominated by SMEs (small and medium enterprises). In fact, 97.2% of all business in Australia (just under 2.6 million) are small businesses (0-19 employees) and a further 2.4% are medium businesses (67,857), employing 20-199 employees.
The remaining 0.2% of businesses in Australia have more than 200 employees.
Among the population of small businesses, 63.5% do not have any employees, 25.2% employ between 1-4 people and 8.5% employ between 5-19 people.
Business finance statistics: earnings and profitability
Mining remains comfortably Australia's largest industry by earnings ($232.9 billion in 2023-24), despite this representing a 15.4% drop in income compared to the previous year.
The decline in earnings was led by the coal mining and oil and gas extraction subdivisions, according to the ABS. These drops were partly offset by a surge on earnings in the metal ore mining subdivision.
Among the other leading industries, earnings increased across real estate services, construction, manufacturing and retail trade. Of the highest-earning industries real estate services saw the biggest year-on-year increase, +9.4% compared to the previous year.
Most profitable businesses in Australia
| Business sector | Profit margin |
|---|---|
Non-metallic mineral mining and quarrying | 49.4% |
Metal ore mining | 41.6% |
Oil and gas extraction | 40.6% |
Creative and performing arts activities | 30.7% |
Medical and other health care services (private) | 28.7% |
Coal mining | 25.2% |
Finance and insurance services | 24.3% |
Professional, scientific and technical services | 24.3% |
Property operators and real estate services | 23.7% |
Rental and hiring services (except real estate) | 22.2% |
Fishing, hunting and trapping | 21.8% |
Forestry and logging | 19.9% |
Water supply, sewerage and drainage services | 19.4% |
“Tough operating conditions saw operating profits fall in seven out of nineteen industries,” said Robert Ewing, ABS head of business statistics.
“The drop in profitability in 2023-24 reflects an economy responding to inflationary pressures, higher interest rates, and lower global demand in key sectors.”
“While some industries benefited from stabilising input costs and strong domestic economic activity, others were impacted by weaker export conditions and higher labour costs.”
The largest rise in operating profit was reported by the Transport Industry ($19.4b), which is also one of the industries with the highest proportion of profitable businesses.
What about the least profitable industries?
Exploration and other mining support services (-6.8%) and water transport were the only two sectors recording a negative profit margin, while several other sectors operated under wafer-thin positive margins.
Least profitable businesses in Australia
| Business sector | Profit margin |
|---|---|
Hospitals (private) | -0.1% |
Primary metal and metal product manufacturing | 2.2% |
Exploration and other mining support services | 2.5% |
Fuel retailing | 2.5% |
Aquaculture | 2.6% |
Water transport | 3.3% |
Basic chemical and chemical product manufacturing | 3.3% |
Library and other information services | 3.4% |
Pulp, paper and converted paper product manufacturing | 4.0% |
Motor vehicle and motor vehicle parts wholesaling | 4.1% |
Rail transport | 4.2% |
Food product manufacturing | 4.7% |
Food retailing | 4.7% |
Motor vehicle and motor vehicle parts retailing | 4.8% |
Grocery, liquor and tobacco product wholesaling | 5.0% |
Petroleum and coal product manufacturing | 5.0% |
A recent Money.com.au survey found fewer than 1 in 5 Australians would consider starting a business in the current climate if the right opportunity came up. Of those who said they would not consider starting a business, the main reasons were:
- The stress and uncertainty of running one (26%)
- The risk in the current economy (20%)
- A lack of capital or resources (13%)
Australian business lending statistics
Business lending in Australia continues to grow steadily. Overall, outstanding finance to businesses was up more than 10% in 2025 compared to the previous year. Lending to large businesses saw the biggest growth in that period (+11.5%).
Business cashflow remains the main driver behind a lot of funding requirements, according to Money.com.au's business lending expert, Phil Collard.
"As an example, building, trade and construction accounts for a large portion of SMEs in Australia and these businesses are generally required to make upfront payments for materials and supplies on projects with income not being realised until certain progress/milestones during the build process," he said.
There's also been a spike in the number of businesses borrowing to pay off ATO tax debt.
"Business owners are now considering funding solutions to satisfy outstanding tax obligations and many are taking the opportunity to consolidate other business debt while they're at it."
Business lending is predominantly at variable rates – 88.2% of outstanding business finance as at January 2026.
The proportion of business finance that's on a variable rate has been creeping up steadily since July 2019 (the earliest records published by the RBA) when it was just over 78%.
Interest rates on business lending have been relatively flat in the last 12 months (to July 2024), in line with a stable cash rate, but businesses are still paying significantly higher rates than they were a couple of years ago.
The greater perceived risk of lending to smaller businesses is reflected in the high rates paid versus larger businesses.
Small business loan statistics
Now let's look specifically at lending to small businesses. According to Money.com.au data, the average small business loan amount requested is $167,272.
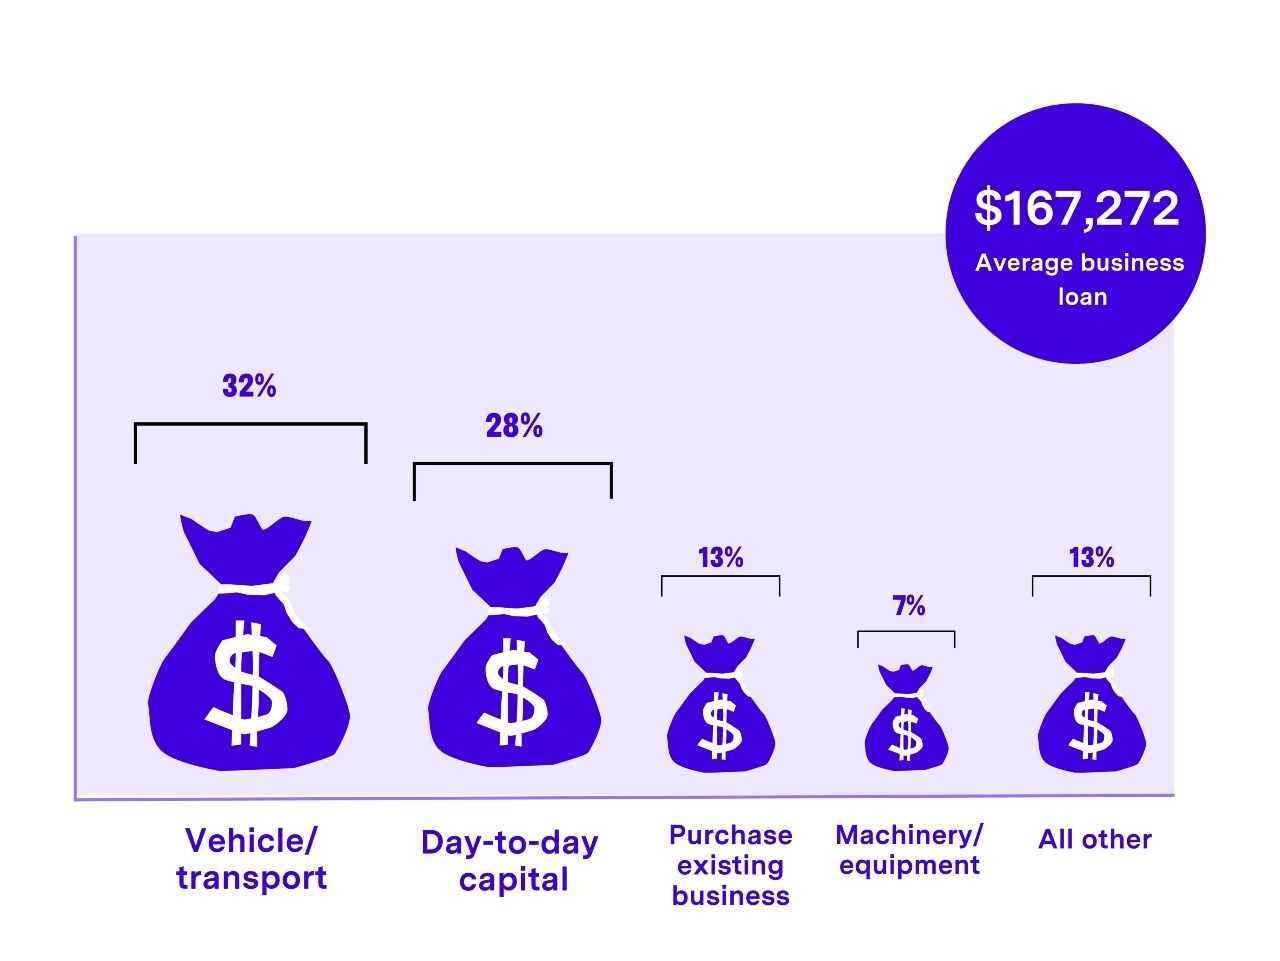
Financing a business vehicle is the most common loan purpose (32%), followed by requests for businesses looking to access finance for day-to-day capital (28%). Just over 13% of all loans were to finance the purchase of another business, while around 7% of requests related to loans for business equipment.
Phil said despite soft conditions in some sectors of the economy, there's been a trend towards businesses borrowing to fund growth.
"This is still being approached with caution, but SMEs are increasingly looking to scale up their business by leveraging loans to help fuel growth," he said.
"The right loan facility can be a very powerful tool to accelerate growth so be sure to have your plans clearly mapped out, including expected ROI."
This trend is reflected in the high average loan amounts for expansion by acquiring an existing business, as well as machinery/equipment purchases.
Average loan amount for different business purposes
| Loan purpose | Average loan amount |
|---|---|
Purchase an existing business | $541,014 |
New fit out | $141,287 |
Day-to-day capital | $102,094 |
Machinery/equipment | $117,394 |
Vehicles/transport | $59,820 |
Other | $233,652 |
Average small business loan by state
| Sate | Average loan amount |
|---|---|
QLD | $182,378 |
NT | $177,739 |
WA | $175,358 |
ACT | $173,192 |
VIC | $165,865 |
NSW | $163,558 |
SA | $135,660 |
TAS | $115,749 |